A pedigree analysis chart, usually used for families, allow us to visualize the inheritance of genotypes and phenotypes (traits). In this chart, the P, F1, and F2 generation are represented by the numerals I, II, and III respectively. Notice that those carrying the trait are colored red, and those not carrying the trait (the normal-looking ones) are in blue. The normal, non-trait carrying organisms on the chart are called the wild-type.
The term wild-type is used in genetics often to refer to organisms not carrying the trait being studied. For example, if we were studying a gene that turns house-flies orange, we would call the normal-looking ones the wild-type.
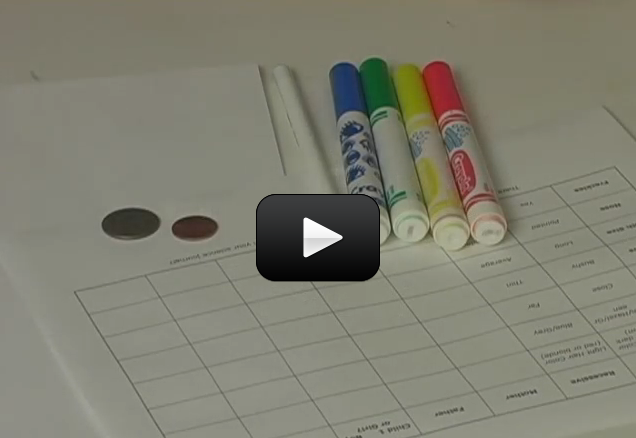
Let’s make a pedigree for your family. Here’s what you need:
[am4show have=’p8;p9;p11;p38;p92;p26;p53;p65;p69;p87;’ guest_error=’Guest error message’ user_error=’User error message’ ]
Materials:
• Paper
• Pen
• Access to a photocopier (optional)
Before starting this science project, you should go through your reference material and familiarize yourself with the proper way to draw a human pedigree (shown below)

To start this project, draw a pedigree showing the different members of your family.
a. Include as many family members as you can get data from. The more people and generations you include, the more likely it is that you’ll have enough information to determine the mode of inheritance.
b. You might need help from your parents to figure out all the relationships.
2. If you have access to a photocopier, make four copies of the pedigree—one for each trait you are going to evaluate. If photocopying isn’t an option, manually copy the pedigree.
3. Determine the phenotype of each person on your pedigree for each of the four traits. Use a separate pedigree for each trait. Examples are: eye-color, hair color, widow’s peak, height. Note: Widow’s peak can vary considerably; score any sort of V-shaped hairline as positive.
4. From your pedigrees, can you deduce the mode of inheritance for each trait? For which traits is your pedigree informative? If you don’t have enough information to determine the mode of inheritance of a particular trait, try making a pedigree for another family.
[/am4show]