 This experiment is one of my favorites in this acceleration series, because it clearly shows you what acceleration looks like.
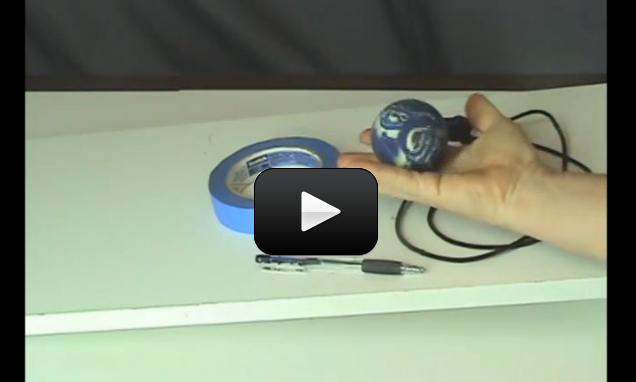
The materials you need is are:
- a hard, smooth ball (a golf ball, racket ball, pool ball, soccer ball, etc.)
- tape or chalk
- a slightly sloping driveway (you can also use a board for a ramp that’s propped up on one end)
For advanced students, you will also need: a timer or stopwatch, pencil, paper, measuring tape or yard stick, and this printout.
Grab a friend to help you out with this experiment – it’s a lot easier with two people.
Are you ready to get started really discovering what acceleration is all about?
Here’s what you do:
Please login or register to read the rest of this content.
Please login or register to read the rest of this content.
Yes, it can look like that. But it can be difficult to tell just by watching. That’s why it is important to use a stopwatch and mark out the distances. That way you can measure how the ball accelerates.
hm it looks like it speeds up a lot at the start and speeds up less as time goes on
There are answers to each of the exercises, and you can also ask here! Did you watch the videos that explain acceleration yet?
When you increase the steepness of the ramp, the acceleration of a soccer ball will also increase when rolls down. Think about it this way: Forces are vectors (which means that they have direction and magnitude), and the force of gravity points straight down from the ball toward the center of the earth. But the ball can’t go straight down to the earth’s core, it has to follow a ramp. That means that only part of the gravitational force (which is the accelerate the ball) points in the same direction as the ball’s motion.
If the ramp is horizontal, the ball would stay put because all of the gravitational force would be pushing on the ramp which pushes back and there’s no motion in that direction. If the ramp were vertical, the ball would freefall drop with an acceleration due to just gravity. The steeper the ramp, the more the gravitational force is involved in accelerating the ball.
We are new to Supercharged Science and haven’t really learned our way around yet. Question number 4 on the excercises asks “what is the highest acceleration it can reach?” We are not sure how to figure out that question. If we don’t understand how to answer a question, where can we go to find the explanation?
Thanks for writing! For this experiment, you’re finding where the ball is at specific intervals in time and learning how to graph it. In the first graph in the worksheet, you are going to graph distance traveled on the vertical and time on the horizontal axes. The slope is rise/run which is distance per time which is speed. (Hint – this should be hard to calculate since the speed starts out slow and then increases more rapidly, so it’s not going to be a straight line.) For the second graph, you’re going to graph distance on the vertical again, but now before graphing the number for time, square it and divide it by 2 first, then graph that number. The slope of the graph is your acceleration, which should now be a straight line. Does that help clarify? It sounds like you have the right idea – just square the time before halving it.
Aurora
In the first graph are we suppose to just graph the average distance and the time? And for the second graph find out what the acceleration woul be with our average distance, then graph the acceleration with the time/halved?
Yes, there’s an entire section on just this topic. It’s in the upper level physics section:
https://www.sciencelearningspace2.com/grade-levels/advanced-projects-2/advanced-physics/
under 1D Kinematics:
https://www.sciencelearningspace2.com/category/advanced-physics/1-d-kinematics/describing-motion-with-equations/
Is there a video that takes you through the driveway experiment math? I don’t know how to do the calculations, I’m stuck.
I believe you have a typo in this section of the Driveway Races Lab:
With a little more math we can see how far our ball should have traveled for each time trial that we did. For one second we see that our ball should have traveled d=1/2 12(12) or d= 6 inches (we knew that one already didn’t we?).
For two seconds we can expect to see that d=1/2 12(22) or d=24 inches.
For three seconds we expect d=1/2 12(32) or d= 54 inches.
————–
The “2” in the (12) is really (1 ^2) — that is 1 squared. Like wise (22) is (2 ^2) or 2 squared, and (32) is (3 ^2) or 3 squared. Many kids will figure this out without any clarification–if they are really understand the material.
You could use LaTex to type set your equations and things would be a lot clearer. Just an idea….
I noticed that the Advanced Student Driveway Lab does not have the answers to the Acceleration Problems printed in the Solutions section. Are they available somewhere else? My child is doing this lab this week and I’d like to be able to check her answers.
Thank you
-Jacob(10)
Terminal velocity is the fastest velocity balanced by the friction experienced. The greater the friction, the slower the terminal velocity. Does that help?
Hi Aurora!
So does that mean that the car will hit terminal velocity because of the friction? Will the ball ever hit terminal velocity?
Thanks!
-Dayini (12) 🙂
Great question! The car experiences more friction than the ball, because it’s got four points where it contacts the road, and it also has wheel bearings, etc… whereas the ball is just a ball, and the unit moves as a whole, so there’s no loss in energy due to friction through wheels, etc. Also – matchbox race cars are not known for their low-friction wheels, either. 🙂 Does that help?
Hi Aurora!
I was wondering why this experiment and the ‘Downhill Race’ experiment is similar but have different results? I mean why does the toy car hit terminal velocity but the ball doesn’t?
Thanks!
-Dayini (12) 🙂
It is raining right now so I will try it in the morning. This is as awesome as Look Out Below!.
sevy keble